America's Affluent: Satisfying Their Needs in an Era of Uncertainty 2002–03 Affluent MacroMonitor Report
| Introduction Table of Contents |
Download the contents and introduction Download the complete report |
Introduction
The market events of the past two years have changed the financial landscape for institutions and consumers. This report examines the current state of the Affluent market and analyzes Affluent consumers' financial needs, behaviors, and attitudes in the context of a dynamic and rapidly changing environment. To be "Affluent" for inclusion in the MacroMonitor's segmentation requires that a household have either a total annual income of at least $100,000 or total assets, excluding the primary residence, of $500,000 or more. Our analyses are based on eight key populations within the overall Affluent group. Definitions of the two larger groups—Mass Affluent and Millionaires households—are based on total household net worth, with the dividing line at $1 million. The six smaller groups represent populations that we have defined consistently since 1992; they allow us to analyze the financial needs and attitudes of Affluent households in the United States that share fundamental wealth attributes that are predictive of financial needs and reflect a combination of preferences for certain types of assets and their wealth-accumulation/distribution status.
Figure 1 shows the present and recent past distribution of Mass Affluent and Millionaires households in the United States.
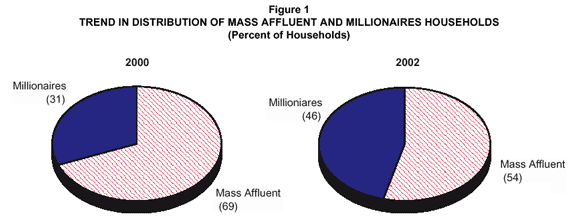
What are some of the forces that drove this dramatic shift in the composition of the Affluent market? How can we gain a better understanding of how consumers' reactions to those defining forces manifest themselves and change the shape of the Affluent population? What are the effects on the behaviors and attitudes of Affluent households as they react to new financial challenges and opportunities? To answer these and other important questions, while developing a meaningful context to advance our understanding of what affluence means in terms of the opportunity to provide financial services to this population, we look at the Affluent population also through the lens of our proprietary segmentation.
The Consumer Financial Decisions (CFD) Affluent Segmentation graphic illustrates and provides definitions for the Affluent population segments that we have been tracking and analyzing for the past decade.
The Consumer Financial Decisions (CFD) segmentation algorithm incorporates demographic, psychographic, life-stage, and behavioral variables to select, cluster, and assess household behavior. It focuses on households with total income equal to or greater than $100,000 or with assets of $500,000 or more (excluding the primary residence). At present, this upscale market comprises 16.5 million Affluent American households. The proprietary model divides the Affluent market into six mutually exclusive household types. We define retired households (under Wealthy Retired) and business owners (under Entrepreneurs) first. We then define the remaining segments on the basis of the value of their primary home and their financial assets. 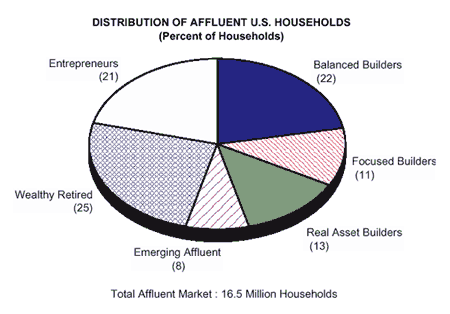
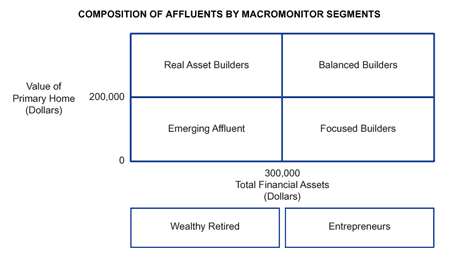 |
Figure 2 shows how our Affluent segments are distributed in the Mass Affluent and Millionaires populations.
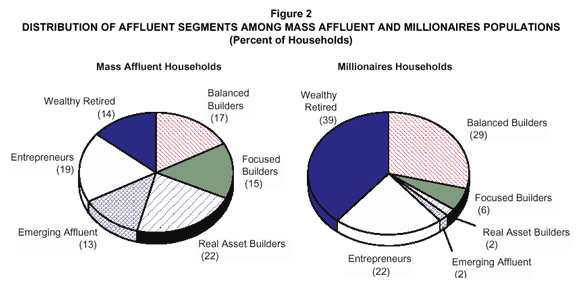
If one is focusing on the Mass Affluent market, the main focus will be on the households characterized by the Real Asset Builders, Focused Builders, and Emerging Affluent segments because more than 70% of the households in each segment fall into the Mass Affluent group. If, on the other hand, one is pursuing the Millionaires market, the Wealthy Retired, Balanced Builders, and Entrepreneurs segments represent 90% of households that have a net worth of $1 million or more. Those three segments are also well represented in the Mass Affluent population and may represent the best opportunity in terms of growing profitability by an acquisition and retention strategy. Figure 3 puts into perspective the relative shares of each segment that qualifies as Mass Affluent or Millionaires households.
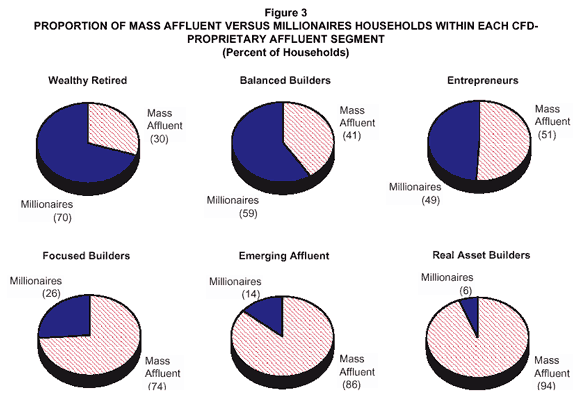
The fact that all the segments represent opportunities within both the Mass Affluent and the Millionaires groups suggests the complex marketing challenge that the Affluent market represents. The key to unlocking the Affluent market opportunity is a thorough understanding of who these households are financially and how they react to changes in the overall market environment. The events of the past two years offer a unique opportunity for gaining meaningful insight into the behaviors and attitudes of the U.S. Affluent population.
| TABLE OF CONTENTS |
||||
| Introduction | 1 | |||
| Executive Summary | 6 | |||
| The Total Affluent Market | 6 | |||
| The Mass Affluent Market | 6 | |||
| Transactions | 6 | |||
| Protection | 7 | |||
| Savings and Investments | 7 | |||
| Credit | 7 | |||
| Information and Advice | 8 | |||
| The Millionaires Market | 8 | |||
| Transactions | 9 | |||
| Protection | 9 | |||
| Savings and Investments | 9 | |||
| Credit | 10 | |||
| Information and Advice | 10 | |||
| The Mass Affluent and Millionaires Markets | 11 | |||
| Mass Affluent Trend Analysis: 2000 versus 2002 | 16 | |||
| Financial Profile | 16 | |||
| Financial Needs of the Mass Affluent | 19 | |||
| Sizing and Segmenting the Market by Age Cohort and Life Stage | 19 | |||
| The Role of Recent Life Events in Shaping the Mass Affluent Market | 21 | |||
| Transactions | 24 | |||
| Protection | 28 | |||
| Savings and Investments | 31 | |||
| Credit | 35 | |||
| Information and Advice | 38 | |||
| Millionaires Trend Analysis: 2000 versus 2002 | 42 | |||
| Financial Profile | 42 | |||
| Financial Needs of the Millionaires Population | 46 | |||
| Sizing and Segmenting the Market by Age Cohort and Life Stage | 46 | |||
| Transactions | 49 | |||
| Protection | 54 | |||
| Savings and Investments | 56 | |||
| Credit | 60 | |||
| Information and Advice | 64 | |||
Segment Profiles |
||||
| Balanced Builders | 68 | |||
| Highlights | 68 | |||
| Demographics | 68 | |||
| Savings and Investments | 68 | |||
| Credit | 68 | |||
| Protection | 69 | |||
| Information and Advice | 69 | |||
| Attitudinal Profile | 75 | |||
| Demographics | 77 | |||
| Savings and Investments | 79 | |||
| Credit | 81 | |||
| Protection | 82 | |||
| Transactions | 82 | |||
| Information and Advice | 83 | |||
| Personal-Computer and Internet Use | 83 | |||
| Trend Analysis: 2000 versus 2002 | 85 | |||
| Focused Builders | 92 | |||
| Highlights | 92 | |||
| Demographics | 92 | |||
| Savings and Investments | 92 | |||
| Credit | 92 | |||
| Protection | 92 | |||
| Information and Advice | 93 | |||
| Attitudinal Profile | 99 | |||
| Demographics | 101 | |||
| Savings and Investments | 103 | |||
| Credit | 104 | |||
| Protection | 105 | |||
| Transactions | 105 | |||
| Information and Advice | 106 | |||
| Personal-Computer and Internet Use | 108 | |||
| Trend Analysis: 2000 versus 2002 | 109 | |||
| Real Asset Builders | 117 | |||
| Highlights | 117 | |||
| Demographics | 117 | |||
| Savings and Investments | 117 | |||
| Credit | 117 | |||
| Protection | 118 | |||
| Information and Advice | 118 | |||
| Attitudinal Profile | 124 | |||
| Demographics | 127 | |||
| Savings and Investments | 129 | |||
| Credit | 132 | |||
| Protection | 133 | |||
| Transactions | 134 | |||
| Information and Advice | 134 | |||
| Personal-Computer and Internet Use | 135 | |||
| Trend Analysis: 2000 versus 2002 | 137 | |||
| Emerging Affluent | 144 | |||
| Highlights | 144 | |||
| Demographics | 144 | |||
| Savings and Investments | 144 | |||
| Credit | 144 | |||
| Protection | 145 | |||
| Information and Advice | 145 | |||
| Attitudinal Profile | 150 | |||
| Demographics | 155 | |||
| Savings and Investments | 156 | |||
| Credit | 158 | |||
| Protection | 160 | |||
| Transactions | 161 | |||
| Information and Advice | 163 | |||
| Personal-Computer and Internet Use | 165 | |||
| Trend Analysis: 2000 versus 2002 | 167 | |||
| Wealthy Retired | 175 | |||
| Highlights | 175 | |||
| Demographics | 175 | |||
| Savings and Investments | 175 | |||
| Credit | 175 | |||
| Protection | 175 | |||
| Information and Advice | 176 | |||
| Personal-Computer and Internet Use | 176 | |||
| Attitudinal Profile | 181 | |||
| Demographics | 186 | |||
| Savings and Investments | 188 | |||
| Credit | 190 | |||
| Protection | 190 | |||
| Transactions | 191 | |||
| Information and Advice | 192 | |||
| Personal-Computer and Internet Use | 193 | |||
| Trend Analysis: 2000 versus 2002 | 195 | |||
| Entrepreneurs | 202 | |||
| Highlights | 202 | |||
| Demographics | 202 | |||
| Savings and Investments | 202 | |||
| Credit | 202 | |||
| Protection | 202 | |||
| Information and Advice | 203 | |||
| Personal-Computer and Internet Use | 203 | |||
| Attitudinal Profile | 209 | |||
| Demographics | 212 | |||
| Savings and Investments | 215 | |||
| Credit | 216 | |||
| Protection | 217 | |||
| Transactions | 217 | |||
| Information and Advice | 218 | |||
| Personal-Computer and Internet Use | 220 | |||
| Trend Analysis: 2000 versus 2002 | 222 | |||
Tables |
||||
Mass Affluent |
||||
| Market Size and Balance-Sheet Trends | 16 | |||
| Asset-Class Incidence and Balance Trends | 17 | |||
Millionaires |
||||
| Market Size and Balance-Sheet Trends | 43 | |||
| Asset-Class Incidence and Balance Trends | 44 | |||
Balanced Builders |
||||
| Demographic Profile | 70 | |||
| Balance Sheet | 72 | |||
| Insurance Product Ownership Profile | 74 | |||
| Balanced Builders: Market Size and Balance-Sheet Trends | 85 | |||
| Balanced Builders: Asset-Class Incidence and Balance Trends | 87 | |||
Focused Builders |
||||
| Demographic Profile | 94 | |||
| Balance Sheet | 96 | |||
| Insurance Product Ownership Profile | 98 | |||
| Focused Builders: Market Size and Balance-Sheet Trends | 109 | |||
| Focused Builders: Asset-Class Incidence and Balance Trends | 112 | |||
Real Asset Builders |
||||
| Demographic Profile | 119 | |||
| Balance Sheet | 121 | |||
| Insurance Product Ownership Profile | 123 | |||
| Real Asset Builders: Median Balances in Savings and Investment Products | 131 | |||
| Real Asset Builders: Market Size and Balance-Sheet Trends | 138 | |||
| Real Asset Builders: Asset-Class Incidence and Balance Trends | 139 | |||
Emerging Affluent |
||||
| Demographic Profile | 146 | |||
| Balance Sheet | 148 | |||
| Insurance Product Ownership Profile | 150 | |||
| Focused Builders: Market Size and Balance-Sheet Trends | 168 | |||
| Focused Builders: Asset-Class Incidence and Balance Trends | 170 | |||
Wealthy Retired |
||||
| Demographic Profile | 177 | |||
| Balance Sheet | 179 | |||
| Insurance Product Ownership Profile | 181 | |||
| Estimated Mean Number of Annual Financial Transactions | 192 | |||
| Wealthy Retired: Market Size and Balance-Sheet Trends | 196 | |||
| Wealthy Retired: Asset-Class Incidence and Balance Trends | 197 | |||
Entrepreneurs |
||||
| Demographic Profile | 204 | |||
| Balance Sheet | 206 | |||
| Insurance Product Ownership Profile | 208 | |||
| Entrepreneurs: Market Size and Balance-Sheet Trends | 222 | |||
| Entrepreneurs: Asset-Class Incidence and Balance Trends | 223 | |||
Figures |
||||
| Trend in Distribution of Mass Affluent and Millionaires Households | 1 | |||
| Distribution of Affluent Segments among Mass Affluent and Millionaires Populations | 4 | |||
| Proportion of Mass Affluent versus Millionaires Households within Each CFD-Proprietary Affluent Segment | 5 | |||
| A Slowdown in Affluent-Market Growth | 11 | |||
| Trend in Distribution of Mass Affluent and Millionaires Households | 12 | |||
| Trend in Relative Proportions of Mass Affluent versus Millionaires | 13 | |||
| Trend in Number of Mass Affluent versus Millionaires Households | 13 | |||
| Distribution of Affluent Households by Net Worth | 14 | |||
| Trend in Numbers of Households Qualifying as Affluent on the Basis of Income Only, Assets Only, or Both | 14 | |||
| Trend in Proportions of Households Qualifying as Affluent on the Basis of Income Only, Assets Only, or Both | 15 | |||
| Trend in Distribution of Incidence of Ownership and Average Assets for All Affluent and Mass Affluent Households | 18 | |||
| Distribution of the Mass Affluent by Age Cohort | 19 | |||
| Distribution of Mass Affluent Households by Life Stage | 20 | |||
| Trend in Incidence of Recent Life Events among Mass Affluent Households | 23 | |||
| Trend in Distribution of Financial Institutions Named as Primary among Mass Affluent Households | 24 | |||
| Trend in Distribution of Preferred Type of Primary Financial Institution among Mass Affluent Households | 25 | |||
| Trend in Incidence of Use of Key Types of Financial Transactions among Mass Affluent Households | 26 | |||
| Trend in the Average Number of Key Types of Financial Transactions among Mass Affluent Households | 27 | |||
| Trend in Incidence of Use of Online Financial Transactions among Mass Affluent Households | 28 | |||
| Trend in Incidence of Insurance Ownership for Major Categories of Insurance among Mass Affluent Households | 29 | |||
| Trend in Incidences of Types of Property and Casualty Insurance among Mass Affluent Households | 29 | |||
| Trend in Group versus Individual Life Insurance Ownership Incidences and Distribution of Individual Policies by Type among Mass Affluent Households | 30 | |||
| Trend in Ownership Incidences of Health and Disability Insurance among Mass Affluent Households | 31 | |||
| Trend in Incidences of Goals for Saving and Investing among Mass Affluent Households | 32 | |||
| Trend in Average Distribution of Household Savings and Investments by Type of Financial Institution among Mass Affluent Households | 33 | |||
| Trend in Incidences of Brokerage Accounts among Mass Affluent Households | 34 | |||
| Trend in Level of Securities Trading Activity among Mass Affluent Households | 34 | |||
| Trend in Purposes for Borrowing among Mass Affluent Households | 35 | |||
| Trend in Incidences of Loans on Primary Residence among Mass Affluent Households | 36 | |||
| Trend in Consumer Loans among Mass Affluent Households | 36 | |||
| Trend in Incidences of Credit-Card Ownership by Type among Mass Affluent Households | 37 | |||
| Trend in Method of Paying Monthly Credit-Card Bill among Mass Affluent Households | 38 | |||
| Trend in Household Financial Strategy among Mass Affluent Households | 39 | |||
| Trend in Level of Confidence Regarding Financial Matters among Mass Affluent Households | 39 | |||
| Trend in Types of Financial Advisors Used during the Past Two Years among Mass Affluent Households | 40 | |||
| Trend in Types of Professional Planners and Advisors That Households Are Likely to Use Next Year among Mass Affluent Households | 41 | |||
| Trend in Distribution of Incidence of Ownership and Average Assets for All Affluent and Millionaires Households | 45 | |||
| Distribution of Millionaires by Age Cohort | 46 | |||
| Distribution of Millionaires by Life Stage | 48 | |||
| Trend in Incidence of Recent Life Events among Millionaires Households | 49 | |||
| Trend in Distribution of Financial Institutions Named as Primary among Millionaires Households | 50 | |||
| Trend in Distribution of Preferred Type of Primary Financial Institution among Millionaires Households | 51 | |||
| Trend in Incidence of Use of Key Types of Financial Transactions among Millionaires Households | 52 | |||
| Trend in the Average Number of Key Types of Financial Transactions among Millionaires Households | 52 | |||
| Trend in Incidence of Use of Online Financial Transactions among Millionaires Households | 53 | |||
| Trend in Incidence of Insurance Ownership for Major Categories of Insurance among Millionaires Households | 54 | |||
| Trend in Incidence of Types of Property and Casualty Insurance among Millionaires Households | 55 | |||
| Trend in Group versus Individual Life Insurance Ownership Incidences and Distribution of Individual Policies by Type among Millionaires Households | 55 | |||
| Trend in Ownership Incidences of Health and Disability Insurance among Millionaires Households | 56 | |||
| Trend in Incidences of Goals for Saving and Investing among Millionaires Households | 57 | |||
| Trend in Average Distribution of Household Savings and Investments by Type of Financial Institution among Millionaires Households | 58 | |||
| Trend in Incidences of Brokerage Accounts among Millionaires Households | 59 | |||
| Trend in Level of Securities Trading Activity among Millionaires Households | 60 | |||
| Trend in Purposes for Borrowing among Millionaires Households | 61 | |||
| Trend in Incidences of Loans on Primary Residence among Millionaires Households | 61 | |||
| Trend in Incidences of Consumer Loans among Millionaires Households | 62 | |||
| Trend in Incidences of Credit-Card Ownership by Type among Millionaires Households | 63 | |||
| Trend in Method of Paying Monthly Credit-Card Bill among Millionaires Households | 64 | |||
| Trend in Household Financial Strategy among Millionaires Households | 64 | |||
| Trend in Level of Confidence Regarding Financial Matters among Millionaires Households | 65 | |||
| Trend in Types of Financial Advisors Used during the Past Two Years among Millionaires Households | 66 | |||
| Trend in Types of Professional Planners and Advisors That Households Are Likely to Use Next Year among Millionaires Households | 67 | |||
| Balanced Builders: Savings and Investment Orientation | 75 | |||
| Balanced Builders: Attitudes toward Financial Institutions and Delivery of Services | 76 | |||
| Balanced Builders: Attitudes toward Professional Financial Advice | 77 | |||
| Balanced Builders, by Age Cohort | 78 | |||
| Balanced Builders, by Life Stage | 78 | |||
| Balanced Builders: Millionaires versus Mass Affluent | 79 | |||
| Balanced Builders: Ownership of Investment Products | 80 | |||
| Balanced Builders: Ownership of Retirement Products | 80 | |||
| Balanced Builders: Median Balance in Retirement Products | 81 | |||
| Balanced Builders: Reliance on Professional Financial Advisors | 83 | |||
| Balanced Builders: Online Financial Activities Now Use | 84 | |||
| Balanced Builders: Use of Financial Services on the Internet | 84 | |||
| Balanced Builders: Trended Attitudinal Profile, 2000 versus 2002 Attitudes toward Savings and Investments | 88 | |||
| Balanced Builders: Trended Attitudinal Profile, 2000 versus 2002 Attitudes toward Financial Institutions and Delivery of Services | 89 | |||
| Balanced Builders: Trended Attitudinal Profile, 2000 versus 2002 Attitudes toward Professional Financial Advice | 90 | |||
| Focused Builders: Savings and Investment Orientation | 99 | |||
| Focused Builders: Attitudes toward Financial Institutions and Delivery of Services | 100 | |||
| Focused Builders: Attitudes toward Professional Financial Advice | 101 | |||
| Focused Builders, by Age Cohort | 102 | |||
| Focused Builders, by Life Stage | 102 | |||
| Focused Builders: Millionaires versus Mass Affluent | 103 | |||
| Focused Builders: Median Balance Held in Stocks and Mutual Funds | 104 | |||
| Focused Builders: Ownership of Stockbrokerage Accounts | 106 | |||
| Focused Builders: Incidence of Having Trust in Various Types of Financial Institutions | 107 | |||
| Focused Builders: Acceptance of Need for Financial Advice | 108 | |||
| Focused Builders: Use of Financial Services on the Internet | 109 | |||
| Focused Builders: Trended Attitudinal Profile, 2000 versus 2002 Attitudes toward Savings and Investments | 113 | |||
| Focused Builders: Trended Attitudinal Profile, 2000 versus 2002 Attitudes toward Financial Institutions and Delivery of Services | 115 | |||
| Focused Builders: Trended Attitudinal Profile, 2000 versus 2002 Attitudes toward Professional Financial Advice | 116 | |||
| Real Asset Builders: Savings and Investment Orientation | 124 | |||
| Real Asset Builders: Attitudes toward Financial Institutions and Delivery of Services | 126 | |||
| Real Asset Builders: Attitudes toward Professional Financial Advice | 127 | |||
| Real Asset Builders, by Age Cohort | 128 | |||
| Real Asset Builders, by Life Stage | 128 | |||
| Distribution of Mass Affluent Households, by Segment | 129 | |||
| Real Asset Builders: Ownership of Savings and Investment Products | 130 | |||
| Real Asset Builders: Likelihood of Making Retirement Account Transactions in the Next 12 Months | 132 | |||
| Real Asset Builders: Incidence of Liabilities | 133 | |||
| Real Asset Builders: Online Financial Activities Now Use | 136 | |||
| Real Asset Builders: Use of Financial Services on the Internet | 136 | |||
| Real Asset Builders: Trended Attitudinal Profile, 2000 versus 2002 Attitudes toward Savings and Investments | 141 | |||
| Real Asset Builders: Trended Attitudinal Profile, 2000 versus 2002 Attitudes toward Financial Institutions and Delivery of Services | 142 | |||
| Real Asset Builders: Trended Attitudinal Profile, 2000 versus 2002 Attitudes toward Professional Financial Advice | 143 | |||
| Emerging Affluent: Savings and Investment Orientation | 151 | |||
| Emerging Affluent: Attitudes toward Financial Institutions and Delivery of Services | 153 | |||
| Emerging Affluent: Attitudes toward Professional Financial Advice | 154 | |||
| Emerging Affluent, by Age Cohort | 155 | |||
| Emerging Affluent, by Life Stage | 156 | |||
| Emerging Affluent: Ownership of Savings and Investment Products | 157 | |||
| Emerging Affluent: Ownership of Retirement Products | 157 | |||
| Emerging Affluent: Risk Orientation | 158 | |||
| Emerging Affluent: Method of Paying Monthly Credit-Card Bills | 159 | |||
| Emerging Affluent: Credit Attitudes | 160 | |||
| Emerging Affluent: Incidence of Mortgage and Credit Insurance | 160 | |||
| Emerging Affluent: Life Insurance Attitudes | 161 | |||
| Emerging Affluent: Difference from Total Affluent in Average Number of Financial Transactions by Type | 162 | |||
| Emerging Affluent: Financial-Advice Attitudes | 164 | |||
| Emerging Affluent: Likelihood of Obtaining Professional Advice in the Next 12 Months | 165 | |||
| Emerging Affluent: Online Financial Activities Now Use | 166 | |||
| Emerging Affluent: Use of Financial Services on the Internet | 167 | |||
| Emerging Affluent: Trended Attitudinal Profile, 2000 versus 2002 Attitudes toward Savings and Investments | 171 | |||
| Emerging Affluent: Trended Attitudinal Profile, 2000 versus 2002 Attitudes toward Financial Institutions and Delivery of Services | 173 | |||
| Emerging Affluent: Trended Attitudinal Profile, 2000 versus 2002 Attitudes toward Professional Financial Advice | 174 | |||
| Wealthy Retired: Savings and Investment Orientation | 182 | |||
| Wealthy Retired: Attitudes toward Financial Institutions and Delivery of Services | 184 | |||
| Wealthy Retired: Attitudes toward Professional Financial Advice | 185 | |||
| Affluent Households with Female Head of Household Only, by Segment | 186 | |||
| Distribution of Affluent Female-Head-Only Households, by Segment | 187 | |||
| Wealthy Retired: Millionaires versus Mass Affluent | 188 | |||
| Wealthy Retired: Risk Orientation | 189 | |||
| Wealthy Retired: Ownership of Financial Assets | 190 | |||
| Wealthy Retired: Use of Professional Financial Advisors | 193 | |||
| Wealthy Retired: Online Financial Activities Now Use | 194 | |||
| Wealthy Retired: Use of Financial Services on the Internet | 195 | |||
| Wealthy Retired: Trended Attitudinal Profile, 2000 versus 2002 Attitudes toward Savings and Investments | 199 | |||
| Wealthy Retired: Trended Attitudinal Profile, 2000 versus 2002 Attitudes toward Financial Institutions and Delivery of Services | 200 | |||
| Wealthy Retired: Trended Attitudinal Profile, 2000 versus 2002 Attitudes toward Professional Financial Advice | 201 | |||
| Entrepreneurs: Savings and Investment Orientation | 209 | |||
| Entrepreneurs: Attitudes toward Financial Institutions and Delivery of Services | 210 | |||
| Entrepreneurs: Attitudes toward Professional Financial Advice | 211 | |||
| Entrepreneurs, by Age Cohort | 212 | |||
| Entrepreneurs, by Life Stage | 213 | |||
| Entrepreneurs: Millionaires versus Mass Affluent | 214 | |||
| Entrepreneurs: Primary Financial Decision Maker | 214 | |||
| Entrepreneurs: Ownership of Investment Products | 215 | |||
| Entrepreneurs: Participation in Traditional IRAs | 216 | |||
| Entrepreneurs: Use of Professional Financial Advisors | 219 | |||
| Entrepreneurs: Online Financial Activities Now Use | 220 | |||
| Entrepreneurs: Use of Financial Services on the Internet | 221 | |||
| Entrepreneurs: Trended Attitudinal Profile, 2000 versus 2002 Attitudes toward Savings and Investments | 225 | |||
| Entrepreneurs: Trended Attitudinal Profile, 2000 versus 2002 Attitudes toward Financial Institutions and Delivery of Services | 227 | |||
| Entrepreneurs: Trended Attitudinal Profile, 2000 versus 2002 Attitudes toward Professional Financial Advice | 228 | |||
Boxes |
||||
| The CFD Affluent Segmentation | 2 | |||
Appendixes |
||||
| A. MacroMonitor Survey Methodology | A-1 | |||
| B. Survey Weighting Procedures | B-1 | |||
| C. Affluent Segment Definitions | C-1 | |||