America's Affluent: On the Threshold of the New Millennium 1998–99 Affluent MacroMonitor Report
| Executive Summary Table of Contents |
Download the executive summary Download the complete report |
Executive Summary
Affluent households in the United States—during these times of economic vigor, technological revolution, and relative worldwide political stability—are a growing market of unprecedented opportunity. However, significant challenges face any institution that seeks to serve and profit from this market. Products and services that were merely adequate to meet the needs of Affluent households in the past will no longer fit their needs in the future. And because advances in the Affluent's capabilities (assets, education, health, and enabling technologies) will continue to grow, the speed with which the Affluent's needs will change will accelerate. As the Affluent change, institutions that do not evolve with them will wither and die.
On the basis of our analysis of the current and previous waves of the MacroMonitor's survey of Affluent households—combined with continuous conversations among the leading financial institutions, associations, government agencies, universities, and consultants and balanced with what the media report–we believe that the following five factors will have the most profound impact on the future of financial services for the Affluent:
- Mass affluence
- Penetration of PC ownership and growth of the Web
- Longer life expectancy
- Women in the workforce and beyond
- Changing nature of retirement.
Something wonderful is happening. The United States has more Affluent households than ever before. And the reason is not just population growth or wage inflation. Some of the explanation is the natural occurrence of an economy that has grown virtually uninterruptedly for nearly a decade. Part of it is attributable to enhanced productivity and the gains from shifting from an industrial and merchandise to an information and service society. Enhancing the situation is an (irrationally?) exuberant stock market that has grown twentyfold in nearly two decades. Finally, economic benefits come from people's living longer, healthier lives.
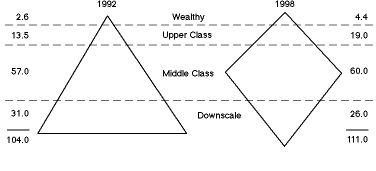
Pyramid to Diamond
(Millions of Households)

Whatever the causes, the effect is that in the United States more households have more resources. This change translates into higher levels of education, more jobs, more forms of entertainment and other diversions, more affluent (calculated by income or net worth per capita), and more millionaires. The danger for a financial institution seeking to serve these households is in making the assumption that they are all alike. As this group grows, so do the variations that make a difference. Treating today's Affluent as a homogeneous group can only provide misunderstanding based on stereotypes and other measures of centrality that drown out the critical distinctions. What is necessary is an effective way in which to separate the Affluent into distinct, cohesive groups, each of which is easy to identify and market to. The CART (Computer Aided Regression Trees) segmentation, which MacroMonitor used initially in 1992 to segment Affluent households and comparably implemented in the three waves of the MacroMonitor since, is such a method.
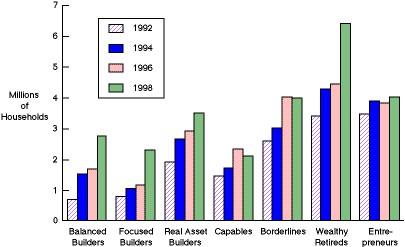
The Affluent Segmentation

The growth and movement that we have seen among the various Affluent segments is readily explainable by the changes in the economy and the stock markets and the natural evolution of standard demographics. The three segments that have historically had the most exposure to the equity markets—the Wealthy Retireds, the Balanced Builders, and the Focused Builders—have all increased significantly in the past two years. The other segment most likely to have equities—the Capables—has not increased significantly because as its financial assets have grown, the Capables have migrated into the Balanced and Focused Builder segments. Conversely, if a major correction occurred in the stock markets, this segmentation suggests that the three segments most affected would be the Wealthy Retireds and the Balanced and the Focused Builders.
 |
 |
 |
| EXECUTIVE SUMMARY | i | |
| BACKGROUND | 1 | |
| THE AFFLUENTS: PRIME TARGETS FOR FINANCIAL PRODUCTS AND SERVICES | 1 | |
| THE CFD AFFLUENT SEGMENTATION | 2 | |
| The Balance Sheet | 3 | |
| Empowerment of the Affluent in the New Millennium | 9 | |
| The Internet and Electronic Finance | 11 | |
| The Economic Environment | 12 | |
| SEGMENT PROFILES | 14 | |
| BALANCED BUILDER HOUSEHOLDS | 15 | |
| Highlights | 15 | |
| Demographic Profile | 16 | |
| Balance Sheet | 18 | |
| Financial Attitudes | 20 | |
| Demographics | 21 | |
| Savings and Investments | 22 | |
| Credit | 23 | |
| Protection | 23 | |
| Transactions | 23 | |
| Information and Advice | 23 | |
| Personal-Computer and Internet Use | 25 | |
| Marketing Implications | 25 | |
| FOCUSED BUILDER HOUSEHOLDS | 26 | |
| Highlights | 26 | |
| Demographic Profile | 27 | |
| Balance Sheet | 29 | |
| Financial Attitudes | 31 | |
| Demographics | 32 | |
| Savings and Investments | 32 | |
| Credit | 33 | |
| Protection | 34 | |
| Transactions | 34 | |
| Information and Advice | 34 | |
| Personal-Computer and Internet Use | 35 | |
| Marketing Implications | 36 | |
| REAL ASSET BUILDER HOUSEHOLDS | 37 | |
| Highlights | 37 | |
| Demographic Profile | 38 | |
| Balance Sheet | 40 | |
| Financial Attitudes | 42 | |
| Demographics | 43 | |
| Savings and Investments | 44 | |
| Credit | 44 | |
| Protection | 45 | |
| Transactions | 45 | |
| Information and Advice | 46 | |
| Personal-Computer and Internet Use | 46 | |
| Marketing Implications | 47 | |
| CAPABLE HOUSEHOLDS | 48 | |
| Highlights | 48 | |
| Demographic Profile | 49 | |
| Balance Sheet | 51 | |
| Financial Attitudes | 53 | |
| Demographics | 54 | |
| Savings and Investments | 56 | |
| Credit | 57 | |
| Protection | 57 | |
| Transactions | 57 | |
| Information and Advice | 58 | |
| Personal-Computer and Internet Use | 58 | |
| Marketing Implications | 59 | |
| BORDERLINE HOUSEHOLDS | 60 | |
| Highlights | 60 | |
| Demographic Profile | 61 | |
| Balance Sheet | 63 | |
| Financial Attitudes | 65 | |
| Demographics | 66 | |
| Savings and Investments | 66 | |
| Credit | 67 | |
| Protection | 68 | |
| Transactions | 68 | |
| Information and Advice | 68 | |
| Personal-Computer and Internet Use | 69 | |
| Marketing Implications | 69 | |
| WEALTHY RETIRED HOUSEHOLDS | 70 | |
| Highlights | 70 | |
| Demographic Profile | 71 | |
| Balance Sheet | 73 | |
| Financial Attitudes | 75 | |
| Demographics | 76 | |
| Savings and Investments | 77 | |
| Credit | 77 | |
| Protection | 78 | |
| Transactions | 78 | |
| Information and Advice | 78 | |
| Personal-Computer and Internet Use | 79 | |
| Marketing Implications | 79 | |
| ENTREPRENEUR HOUSEHOLDS | 80 | |
| Highlights | 80 | |
| Demographic Profile | 81 | |
| Balance Sheet | 83 | |
| Financial Attitudes | 85 | |
| Demographics | 86 | |
| Savings and Investments | 87 | |
| Credit | 88 | |
| Protection | 88 | |
| Transactions | 88 | |
| Information and Advice | 89 | |
| Personal-Computer and Internet Use | 89 | |
| Marketing Implications | 90 | |
| Assets | 4 | |
| Liabilities | 5 | |
| Net Worth | 5 | |
| Net Worth Excluding Primary Residence | 6 | |
| Financial Assets | 6 | |
| Investable Assets | 7 | |
| Liquid Assets | 8 | |
| Home Equity | 8 | |
| Savings | 9 | |
| Balanced Builders: Sources of Income | 22 | |
| Capables: Sources of Income | 56 | |
| Wealthy Retireds: Sources of Income | 76 | |
| Pyramid to Diamond | ii | |
| The Affluent Segmentation | iii | |
| PC Use by Affluent Segments | iv | |
| PC Banking by Affluent Segments and PC Investing by Affluent Segments | v | |
| Working Women by Affluent Segments | vii | |
| Marital Status among the Affluent | viii | |
| Trend and Projection of Life Stages | ix | |
| Percent Distribution of American Affluent Households | 2 | |
| Balance Sheet for America’s Affluent | 3 | |
| Average Household Income per Affluent Segment | 9 | |
| Discount Brokerage Penetration of American Affluent Segments | 13 | |
| Balanced Builders: Education of Primary Head of Household | 21 | |
| Balanced Builders: Median Household Income | 21 | |
| Balanced Builders: Financial Decision Maker | 24 | |
| Balanced Builders: Computer Use and Online Access at Home | 25 | |
| Focused Builders: Education of Primary Head of Household | 32 | |
| Focused Builders: Financial Decision Maker | 35 | |
| Focused Builders: Computer Use and Online Access at Home | 36 | |
| Real Asset Builders: Education of Primary Head of Household | 43 | |
| Real Asset Builders: Median Household Income | 44 | |
| Real Asset Builders: Computer Use and Online Access at Home | 47 | |
| Capables: Median Household Income | 54 | |
| Capables: Median Age of Head of Household | 54 | |
| Capables: Marital Status | 55 | |
| Capables: Education of Primary Head of Household | 55 | |
| Capables: Computer Use and Online Access at Home | 58 | |
| Borderlines: Education of Primary Head of Household | 66 | |
| Borderlines: Computer Use and Online Access at Home | 69 | |
| Wealthy Retireds: Computer Use and Online Access at Home | 79 | |
| Entrepreneurs: Education of Primary Head of Household | 86 | |
| Entrepreneurs: Financial Decision Maker | 87 | |
| Entrepreneurs: Computer Use and Online Access at Home | 89 | |
| A. MacroMonitor Survey Methodology | A-1 | |
| B. Survey Weighting Procedures | B-1 | |
| C. Affluent Segment Definitions | C-1 | |