MacroMonitor Market Trends March 2007
MacroMonitor Market Trends highlights topical news and trends of interest to you and your colleagues. If you would like more information about the items in the newsletter or would like to discuss other ways that we can assist you in your research and marketing efforts, please contact us.
In this issue:
Life Stage Trends: Changes and Implications

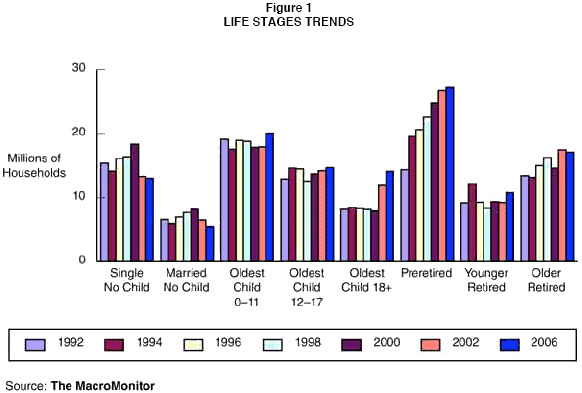
The change in household formation that we first noticed in 2002 continues even as the economy recovers from the recession in 2001 and improves in most overall measures. The increasing number of households with dependent children 18 years of age or older establishes the reality of an Extended Adolescence life stage—a stage in which young adults choose to live at home with their parents—among many (but not all) Gen X/Yers. The financial implication of young adults' remaining dependent on their parents longer than they have in years past has an implication for their parents now and in the future: decreased disposable income with which to pay down debt or to save and invest for future needs.
In 2006, the number of Preretired households reverted to its 2002 level, a result of Boomers' making their way into their sixties. And the number of Younger Retired households is seeing an uptick—another result of Boomers' aging. Now that enough Boomers are retired, we can begin to analyze them and see how different they really are from previous retirees. The Revolving Retired, a household life stage that CFD first described in 2001 and measured in 2002, now numbers 5.6 million and continues to grow as a proportion of households with no dependent children and with a primary head 50 years old or older. With three waves of data behind us, we can now establish fairly precisely how Revolving Retired households' financial needs differ from those of other Retired or Preretired households and how those needs are growing.
Finally, the segment Oldest Child 0–11—households with oldest dependent child younger than age 12—remains at 20 million households, indicating that the birth dearth that many industrialized countries are experiencing is not finding its way to the United States, even as that country's number of immigrants continues to increase.
Where Consumers Are Putting Their Savings and Investments
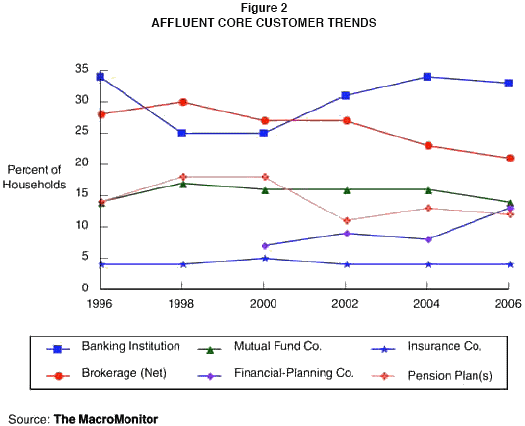
The MacroMonitor has introduced a new Core Customer segmentation of Affluent households: households with an annual income of $100,000 or more or total financial assets, excluding the home, of $500,000 or more. The Core Customer segments are defined by where each household keeps the greatest proportion of its savings and investment dollars. As the market bubble reached its maximum girth from 1998 to 2000, banking institutions saw a sharp and sustained decline in the incidence of households' naming them as their main repository for financial assets. During that period, the percentage of households with the greatest proportion of their assets in pensions hit its high point, and brokerages captured a greater share of households' financial business than did banking institutions. Although they show a modest downturn in the most recent period (2004–06), banking institutions have consistently profited from consumers' response to the instability in equity markets after 2001. Brokerages maintained their share of Affluent core customers into 2002 but suffered a sharp decline in confidence, by this measure, in the past four years. Mutual fund companies, battered by scandals in the recent past, enjoyed an uptick from 1996 to 1998 and sustained a relatively even share of Affluent core customers for six years before losing share in the 2004-to-2006 period. The percentage of insurance companies' core customers (any Affluent household with 30% or more of its savings and investments at an insurance company) has remained very consistent at 4% to 5% of Affluent households in the past decade. The real star of the past two years is the financial-planning-company segment, which increased its share of Affluent core customer households by nearly 40% (from 8% to 13% of Affluent households) from 2004 to 2006. Clearly, Affluent households are seeking the services of financial-planning companies in increasing numbers.

Correlation: Use of Financial Advisors and Recent Life Events
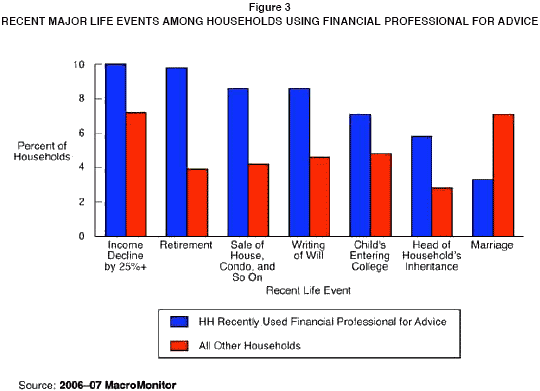
Knowing when people are likely to turn to a financial professional for advice could help financial professionals identify potential prospects to target. The 2006–07 MacroMonitor identifies several recent life events that correlate with the recent use of a financial professional. Although some of these correlations to the use of a financial professional—such as the retirement of or inheritance by a household head—are logical and intuitive, other such correlations—such as writing a will, selling a house, or a child's entering college—are more difficult to explain. Still others, such as an income decline of 25% or more, appear almost counterintuitive. It is interesting to note that the recently married are significantly less likely to have used a financial professional in the past two years—although this point in their lives might have been an especially good time to invest in planning their future.
Using the MacroMonitor, the financial professional can determine which products households bought and sold and whether they used a financial professional in the same time frame (in the past two years) that a recent life event occurred. Use of this information would facilitate the design of the right combination of products and services to offer consumers. In addition, MacroMonitor clients may pull trends about these and other correlations from our data to see if relationships are new, growing, or shrinking.
