Asian Americans by VALS™ January 2018
In September 2017, the Pew Research Center published a report about the diverse and growing Asian American population. Working with the US Census Bureau's 2015 American Community Survey (American FactFinder), Pew reports "The U.S. Asian population grew 72% between 2000 and 2015 (from 11.9 million to 20.4 million), the fastest growth rate of any major racial or ethnic group." Pew anticipates that by 2055, Asians will surpass Hispanics to become the largest US immigrant group (38% Asian versus 31% Hispanic). Twenty percent of the US Asian population trace their roots to three countries: China (4.9 million), India (4 million), and the Philippines (3.9 million). Asian Americans are twice as likely as all adults to live in one of the top five largest US cities—New York, New York; Los Angeles, California; Chicago, Illinois; Houston, Texas; and Philadelphia, Pennsylvania—and are more than twice as likely as all adults to live in the Pacific marketing region of the United States: California, Oregon, and Washington.

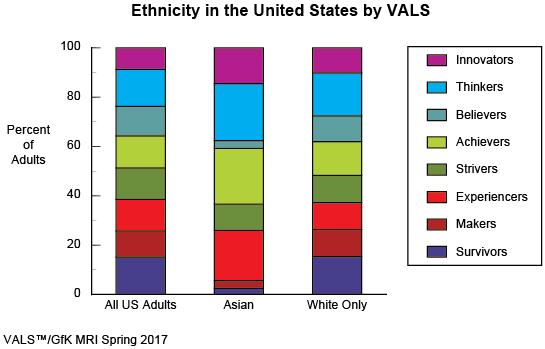
Asian Americans have higher proportions of VALS upper-resource groups—Innovators, Thinkers, Achievers, and Experiencers—than all US adults have. Spring 2017 VALS™/GfK MRI reports these groups represent 81% of Asian Americans. The remaining 19% of Asian Americans tend to live at or below the poverty line.
Culturally, Asians focus on family, education, self-improvement, and financial success. For example, Asian Americans' mean amount of individually earned income is $61K, in comparison with $50K for all adults, and their mean household income is $107K versus $80K. Asian Americans' income levels reflect three factors: A high proportion (66%) have a four-year college or postgraduate degree; Asian Americans are more than twice as likely as all adults to be professionals or to have a profession-related career and are more likely than all adults to work in management, business, and financial operations; almost half of Asian Americans (49%) are Millennials. Young Asian Americans (18%) are twice as likely as all Millennials to live at home—they are reporting their parents' household income.
To illustrate, VALS has the ability to uncover cultural differences: We compare 42 GfK Roper Values to all US adults and Asian-American adults by Innovators and Achievers. The following table highlights several values that culture influences (higher-than-average incidences have a blue shade).
Example Comparison of Values by VALS |
||||||
|---|---|---|---|---|---|---|
| Value (Very Important) | All US Adults (Percent) | All Asian Americans (Percent) | Innovators (Index) | Asian-American Innovators (Index) | Achievers (Index) | Asian-American Achievers (Index) |
Source: VALS/GfK MRI Spring 2017 |
||||||
| Status | 23 | 45 | 105 | 173 | 93 | 174 |
| Power | 27 | 48 | 73 | 144 | 94 | 144 |
| Self-interest | 33 | 50 | 67 | 120 | 95 | 160 |
| Wealth | 34 | 51 | 110 | 122 | 110 | 176 |
| Social responsibility | 69 | 84 | 123 | 139 | 90 | 114 |
For companies that want to reach a specific ethnic group, understanding if cultural differences exist and how they differ is very important. Cultural differences between all Americans and Asian Americans more likely exist among younger groups such as Innovators, Achievers, and Experiencers than among more established Thinkers. The same types of differences may or may not exist for other ethnic populations such as Hispanic Americans or African Americans. Ethnic marketing efforts will benefit from an analysis.
Contact us to learn more about Asian Americans.
Visit the Why-ology Library for previously featured items and additional featured content. Be sure to visit the VALS homepage for more articles. Now featured: