Worried and Stressed about Money? August 2018

The US Federal Reserve System's Report on the Economic Well-Being of U.S. Households in 2017 (published May 2018) found that 59% of individuals could fairly easily handle an emergency expense of $400; 41% of individuals would need either to sell something or to borrow money to meet a $400 emergency. To understand better which consumer households are worried and stressed about money, a VALS™ analysis of the MacroMonitor 2016–17 Recontact Study data reveals that almost 57% of US households say they have no money worries, or if they do have worries, they don't feel stressed about them.

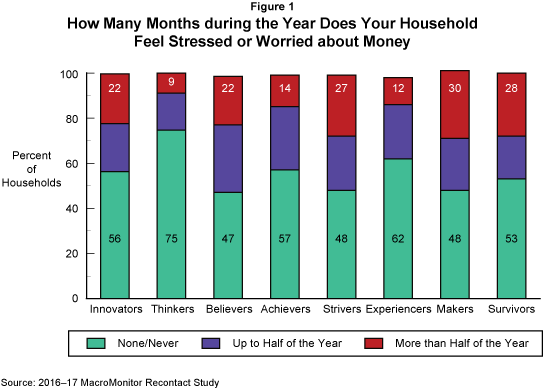
The Recontact Survey asks respondents about the duration of their concern. Perhaps surprisingly, some portion of all households by VALS are financially worried and stressed—just as some portion of each VALS group is not. Clearly, the higher resource groups—Innovators, Thinkers, Achievers, and Experiencers—are more likely than VALS lower-resource groups—Believers, Strivers, Makers, and Survivors—to say they have no worries or stress. However, more than just financial resources define the VALS groups. For example, even worried and stressed Innovators are more confident and willing to take a chance than are any of the other groups.
Because VALS developed on the basis of its own survey and proprietary algorithm, the system provides a reliable lens through which to analyze consumer-behavior data; the groups are consistent. Marketers have the ability to analyze all data sets that include the VALS battery (questionnaire) over time and across samples. Such an analysis not only leverages an organization's research investment but also provides the deep understanding necessary to build a robust profile of each group. One data point, such as the duration of financial stress and worry in Figure 1, will trigger a search for additional data to support the first finding and to provide additional insight about why each group is most likely to respond to a survey question as it does.

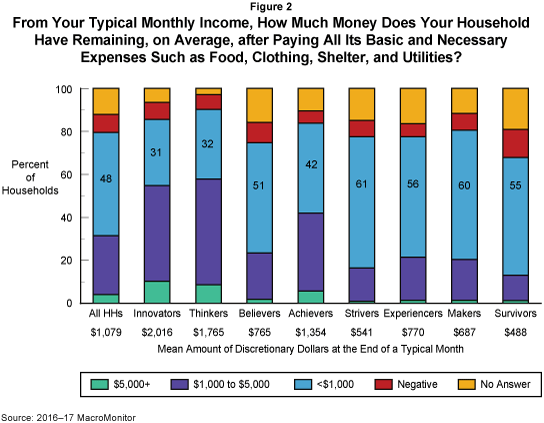
To illustrate VALS's connectivity, we pair the question about worry and stress from the Recontact Study with a question about discretionary income from the MacroMonitor's biennial survey of US economic households. We asked Respondents how much money their household has remaining at the end of a typical month after they pay basic expenses. We do not itemize expenses beyond food, clothing, shelter, and utilities, because the measure is for discretionary money for spending, saving, or investment. Although entertainment and vacation travel expenses are unlikely to be included as basic expenses, monthly cell-phone and internet-provider bills, health-care premiums, and loan repayments may be included. In addition to reporting the proportions of discretionary income, Figure 2 also notes the mean, or average, amount of discretionary dollars for each VALS group.
In rank order, Survivors, Experiencers, Believers, and Strivers are more likely than all households to have negative discretionary dollars. These same four groups, plus Makers, have higher-than-average proportions of households that either need financial assistance or are struggling financially to make ends meet each month. Although Thinkers, Innovators, and Achievers households are more likely than all households to have more than $1,000 a month in discretionary dollars, Innovators households are almost twice as likely as Achievers households to have more than $5,000 a month.
Results in a comparison of the proportion of each group's duration of worry and stress (Figure 1) with the proportion of discretionary dollars for each group (Figure 2) may leave an analyst with more questions than answers about why each group may or may not be worried and stressed about its finances. Overall, fewer households are worried or stressed about their finances than are households in financial difficulty (21% versus 31%)
| All Households (Percent) |
Innovators (Percent) |
Thinkers (Percent) |
Believers (Percent) |
Achievers (Percent) |
Strivers (Percent) |
Experiencers (Percent) |
Makers (Percent) |
Survivors (Percent) |
|
|---|---|---|---|---|---|---|---|---|---|
Source: 2016–17 MacroMonitor; 2016–17 MacroMonitor Recontact Study |
|||||||||
| Negative discretionary dollars or need assistance each month | 31 | 16 | 9 | 41 | 19 | 37 | 40 | 42 | 44 |
| Stressed or worried one-half year or more | 21 | 22 | 9 | 22 | 14 | 27 | 12 | 30 | 28 |
The reason for the discrepancy (discretionary dollars versus worry and stress) varies by VALS group; Thinkers is the only consumer group without a discrepancy. Which consumer group(s) is simply resigned? Which group(s) is in denial? Members of which group(s) worry needlessly? And, for which groups is the lack of financial concern the result of their perception that their household is doing "good enough" to have become their reality? By design, VALS answers these types of marketers' critical questions. To learn more about the consumer groups and how to use consumer motivations to answer hard questions that will benefit your business, please contact us.
Related Material
- "Money-Related Stress and Worry", July 2018 CFD MacroMonitor Market Trends Newsletter
Visit the Why-ology Library and VALS homepage for more articles. Now featured: