Wedding Bells August 2018
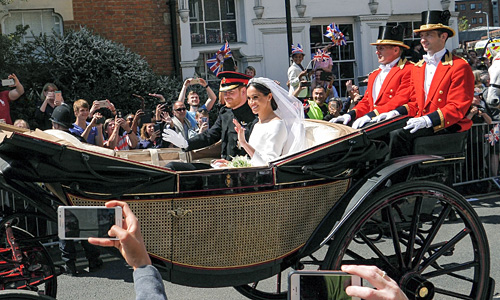
The Royal Wedding of the United Kingdom's Prince Harry and American divorcée Meghan Markle on 19 May 2018 provided an estimated 29 million viewers in the United States alone (according to Nielsen) with a brief but possibly welcome respite from the day's political and murder-and-mayhem news headlines. Now Harry and Meghan are the Duke and Duchess of Sussex. Very few newlyweds receive titles or have the Royal Exchequer pick up the tab, but—with few exceptions—every bride is a princess on her wedding day.
In the United States, only one-third of people marrying have not been wed previously. The average cost of a wedding was $26,000 in 2017, according to the Economist. In total, the wedding industry accounts for $72 billion in annual expenditures. Today, the bride's parents pay for only 17% of weddings; the bride and groom pay 30% of the time; the majority of weddings are paid for by a combination of parents and the intended couple. "Although strong consumer buying power has slightly boosted revenue, the falling marriage rate has limited demand," reports IBIS World (an industry research provider) in December 2017.
Data from VALS™/GfK MRI show the proportion of married US adults in fall 2017 is 53%, in comparison with 57% in fall 2002. The group with the largest decrease in the proportion of married adults is Innovators—from 66% in 2002 to 42% in 2017. The proportions of married Strivers and Experiencers have decreased by 10% and 6%, respectively. In contrast, the proportion of married Achievers has increased by 11%. Of these four VALS consumer groups, Achievers are the most likely to have married in the past 12 months.

Achievers follow life's traditional path: education, independence, marriage, and parenting. Following historical expectations explains, in part, why Achievers are the anchors of the status quo. Achievers see marriage as a life goal—a marker of success. Accepting the importance of projecting an image of a successful marriage—even if it is not always true—Achievers are the least likely of all the groups to divorce—somewhat fewer than 4% divorce (the national average is 11%)—and the most likely to have children younger than age 18 (67% have children).
Check out VALS Sample Characteristics and Sample Demographics and Behaviors to learn more about Achievers and the other seven groups.
To learn more about the VALS types and the most appropriate VALS target for your business, contact us.
Visit the Why-ology Library and VALS homepage for more articles. Now featured: