How to Read MacroMonitor Data Tables
Depending on the software package used to create crosstabulated tables, reference information may or may not be available on the table, and data do not always appear in the same order. As a quick refresher, the following slides step through the various components on the online crosstab tables that the standard MacroMonitor banner provides. The example banners below are truncated because of space limitations—not all populations appear.
Basic Reference Information About the Table
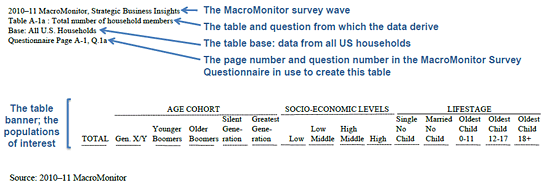 View larger
The Weighted Base
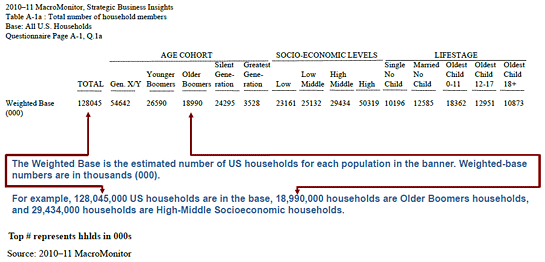 View larger
Variables and Base Rate
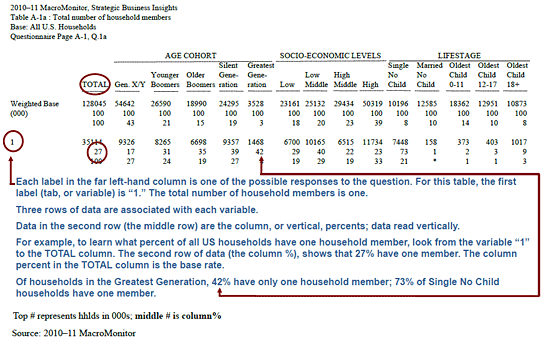 View larger
The Horizontal Percent—Distribution or Composition
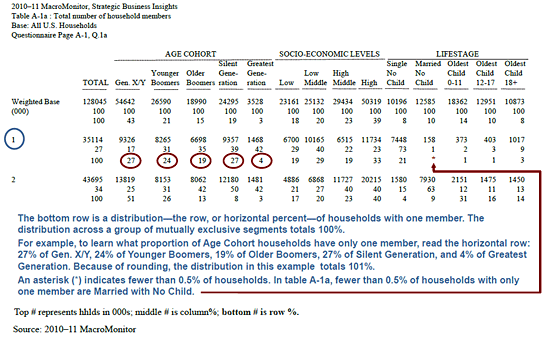 View larger
The Unweighted Base
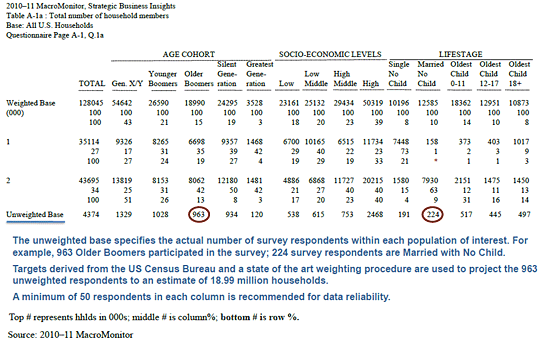 View larger