Trade-Offs: Eating Out February 2017
The evidence is conclusive that eating out is on the upswing. The US Bureau of Labor Statistics' Consumer Expenditure Survey shows food-away-from-home spending increased 7.9% in 2014 and another 6.2% in 2015: 2014 saw the peak of weekly grocery-store expenditures (see Do Millennials Really Hate Groceries?). Although a 2016 Pew Research Center survey found that 54% of Americans believe that consumers seek more healthful food choices than they did two decades ago, the fact is that Americans are eating less healthful food than they did previously. In addition to doing the survey, Pew also studied 40 years of US Department of Agriculture data, with the conclusion that "American eating habits" are all across the board. The Pew conclusion is on the mark. More consumers today are eating out at various types of restaurants, ordering food online and on their phones, or grabbing groceries from nearby places such as convenience stores and drug stores and—not necessarily more convenient—superstores, such as Walmart.
Everyone needs to eat. Declining weekly grocery spending and rising restaurant (away-from-home) spending suggests that more consumers are trading off time-intensive home-prepared meals for (sometimes) cheap restaurant meals. All-over-the-place eating habits are not helpful to restaurant owners or franchise companies trying to grow their business in a changing marketplace. VALS provides insights about how consumer groups are effecting a trade-off and why.
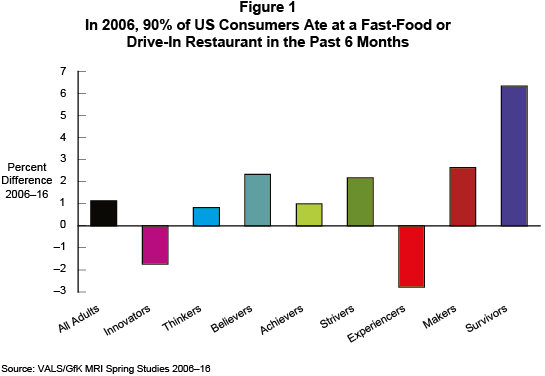
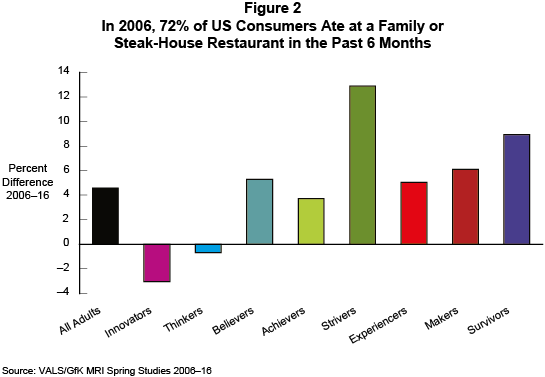
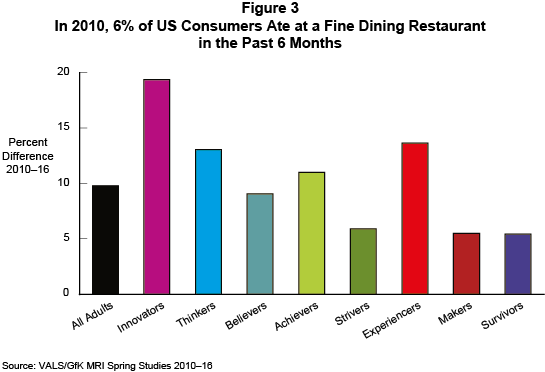
A topline summary of trended VALS™/GfK data reveals that not all types of restaurants are benefiting from increasing visits. GfK MRI's Survey of the American Consumer breaks restaurants into three categories: fast-food and drive-through restaurants, family and steak-house restaurants, and fine-dining restaurants (fine dining has no specific definition). The following figures show the percent differences by VALS group between the first year of study through 2016. Percent difference derives from subtracting the 2016 percent for each group from the 2006 percent for each group for fast-food/drive-through restaurants, for example, in Figure 1. Gains and losses are uneven across restaurant type and by VALS group. The data do not include the number of visits that, no doubt, vary widely by group. For example, at the extremes, Innovators are the most likely and Survivors the least likely to eat out frequently.
In 2006, 90% of US adults visited a fast-food or drive-through restaurant in the past 6 months. Although the population grew at a steady pace between 2006 and 2016, the proportion of consumer visits to fast-food/drive-through restaurants has not kept pace: In 2016, 91% of adults visited a fast-food/drive-through restaurant. The proportions of Innovators and Experiencers visits have declined, but because of small differences between 2006 and 2016, the proportions are basically flat: These two groups are more health conscious than others. Survivors show the biggest gains in fast-food/drive-through restaurant visits. VALS enables users to understand that Survivors are the most likely to make a trade-off because of continually rising grocery prices and because not fixing a meal represents an affordable luxury.

In 2006, 72% of US adults visited a family or steak-house restaurant in the past 6 months; in 2016 the percent of US adults has risen to 76%. Overall, the gain is not large, but with the VALS groups, some very real differences exist between the 2006 and 2016 proportions of visits in Figure 2. As Figure 1 shows for fast-food restaurants, very small changes exist in the percent of Innovators and Thinkers visits to family or steak-house restaurants in Figure 2. Strivers show the largest positive percent difference (+13%), followed by Survivors (+9%) and Makers and Believers (each with a +6% difference). Many Strivers care little about eating healthfully; many Makers, Believers, and Survivors do care, but for different reasons. Doctors and the media have been warning about the danger of high intakes of salt, sugar, and corn-fructose for some time. People under a doctor's care should be aware of the dangers of eating too much fast food; as a result, they may prefer to eat at family restaurants as often as possible: Survivors for health reasons; Makers and Believers because they can take their kids. Restaurant genres will vary between groups. Makers may prefer a steak restaurant, whereas Survivors may prefer Italian, and Believers may prefer Mexican fare.

The restaurant category enjoying the greatest increase in six-month visits is fine dining. GfK MRI did not measure fine-dining restaurants before 2010. All groups show a positive increase in Figure 3. The proportion of visitors increased from 6% of US adults in 2010 to 16% in 2016 (a +10% difference). Innovators (with a +19% difference) are the most likely of all groups to enjoy fine dining; Makers (a +6% difference) and Survivors (a 5% difference) are the least likely. In rank order following Innovators, the groups with large increases are Experiencers (a +14% difference), Thinkers (a +13% difference), and Achievers (an +11% difference).
Previously, fine-dining restaurants were "white-tablecloth" restaurants. The distinction no longer applies: Some family-style neighborhood restaurants now boast white tablecloths, and some restaurants offering gourmet cuisine use no tablecloths at all. Most of the VALS types will define fine dining differently; what constitutes fine dining to Makers may be far different from what constitutes fine dining to Innovators or Thinkers. Of the latter two groups, Innovators are more likely than Thinkers to consider a fine meal a worthwhile experience; Thinkers are more likely to think very upscale restaurants a waste of money.

This article provides a useful topline look to understand better which consumers are eating out. However, for marketing purposes, a much deeper analysis is necessary. For example, we would begin a VALS project by analyzing the available data in VALS/GfK MRI about a category such as restaurant visits by type in the past 30 days, visits for which meals, weekday and weekend visits (by meal), and restaurant expenditures in the past 30 days, and by identifying the decision maker for where to go. GfK MRI has added an "other" restaurant category as of spring 2016. Additional data are available through your proprietary survey that includes the VALS questionnaire. Because VALS enables users to link surveys so that research knowledge expands, once VALS develops a target or targets, a strategy can develop to market to target most effectively. For marketing tactics, we link back to VALS/GfK MRI for lifestyle measures, demographics, buyer behaviors, attitudes, and media-use data.
Visit the Why-ology Library for previously-featured items and additional featured content.
For more information about VALS project work, contact us.